

Author: Frank Carius
Enterprise Architect / Partner – connect on LinkedIn
For decades, Exchange administrators have monitored their local servers with traditional network monitoring. With the rising importance of cloud services, the requirements are constantly changing. In this blog article, we will show you which approach you need to take for your Exchange Online cloud monitoring to optimally support your users in their daily work.
Traditional monitoring as a starting point
Anyone who has operated an Exchange Server themselves was well advised to monitor it. This classically included the following four aspects:
- Numerical values such as CPU load, RAM utilization, degree of filling of the hard disks
- Monitoring of started services and accessibility from the network
- Functional monitoring through synthetic transactions, logging in via EWS, sending and receiving roundtrip mails
- Monitoring of the event log for errors and warnings
For this purpose, solutions such as Nagios, Icinga and PRTG were installed in the server room, which can be used to monitor other servers and the company network in addition to Exchange. The individual desktop client was managed more by inventory and software distribution, but not directly monitored. Discover why this is important for your network monitoring, especially with the rise of cloud services, in the post “Update your traditional network monitoring for the cloud” on our blog.
Challenges of cloud monitoring
Almost all traditional monitoring approaches fail when it comes to Exchange Online or any other cloud services. The service provider operates the servers, in this case Microsoft, and are no longer accessible to the company via conventional monitoring. Monitoring the CPU load of a single server or all servers is simply not possible in a cloud environment, as the operator hides many servers behind load balancers. Events logs or hard disks are also no longer accessible. Only the accessibility of the respective services can be checked, and synthetic transactions executed.
If you previously monitored your servers in the data center using your own agents in the same data center, then these agents can now talk to the service in the cloud. However, to do this, the agents must first come to the cloud and address a meaningful address there, which also provides a response in a timely manner. In addition, cloud monitoring must not be designed in such a way that the cloud provider might suspect a DoS attack. In the best case, your requests would only be throttled consequently. In the worst case, your requests would be blocked based on the IP address. At the same time, regular access via the same IP address would also be blocked.
You must therefore choose other ways to determine a qualified status of the cloud services used and include it in your monitoring.
Exchange Online and synthetic transactions
Exchange Online is a good example to disprove another misconception. Many companies monitor the function of their environment, for example, by regularly sending mails that can also be retrieved within a time limit. If the test message fails to arrive, then there could be an error within the chain. This procedure, though, does not make sense with Exchange Online. You can check this quite easily yourself.
Using Exchange PowerShell, you can read out the “home server” and the mailbox database for each mailbox:
The two values contain references to locations, server names, database names, cluster groups, and pod groups that we can further evaluate:
From a real customer environment with about 35,000 mailboxes, we thus identified about 28,000 databases on over 7000 servers in almost 500 DAGs, which were distributed over 9 locations in 33 data centers. And these were only the mailbox servers in Europe. This does not even include client access via additional CAFE servers, which first route a request to the correct data center and then to the mailbox server.
However, monitoring a single test mailbox does not provide any insight into the quantity and distribution of servers and services. Read more about EXO Mailbox server Insight on my msxfaq-Blog.
Integration of the status query via Graph into your cloud monitoring
Just because your existing monitoring is no longer suitable, you do not have to remain blind. Microsoft provides a status in the admin portal at “health overview” and “service health”, which you can also query via Microsoft Graph and transfer to your cloud monitoring. In this way, you can indirectly monitor the function of the cloud services for your tenant. Learn more about the Service Communications API in Microsoft Graph on Microsoft Learn.
Connection monitoring from client to cloud service
Now, it may still happen that the cloud does not report an error , but your users complain about poor usability of the service. There are still many obstacles on the path between your client and the cloud service that are not monitored by your local monitoring or the cloud provider.
Communication paths in the cloud and their monitoring.
With optimized configuration, the packages of your users in the home office do not even pass through your company network on their way to the cloud. Even the systems in your company leave your managed network after a few stations.
For reliable statements, you need to adjust your monitoring to detect problems. Ideally, the connection to the cloud services is monitored from the user’s point of view, for example with Rimscout, as shown in the image by the blue arrows. A screening through your existing monitoring with a main focus on the servers (displayed with the green arrows) is possible, but only captures a subset. However, very few of your end users work in the server room and what counts is what arrives at your users’ clients.
Seamless cloud monitoring with Rimscout
All these considerations were the trigger to fill exactly this gap with Rimscout. With end-to-end monitoring like Rimscout, you can monitor connections to cloud services such as Exchange Online from the perspective of your users.
A small agent on your users’ endpoints determines the accessibility and performance of numerous services. You can easily install the Rimscout client on any Windows device. It automatically registers with the right instance, obtains the intended tasks from the defined test sets, and reports the results to your Rimscout portal for evaluation.
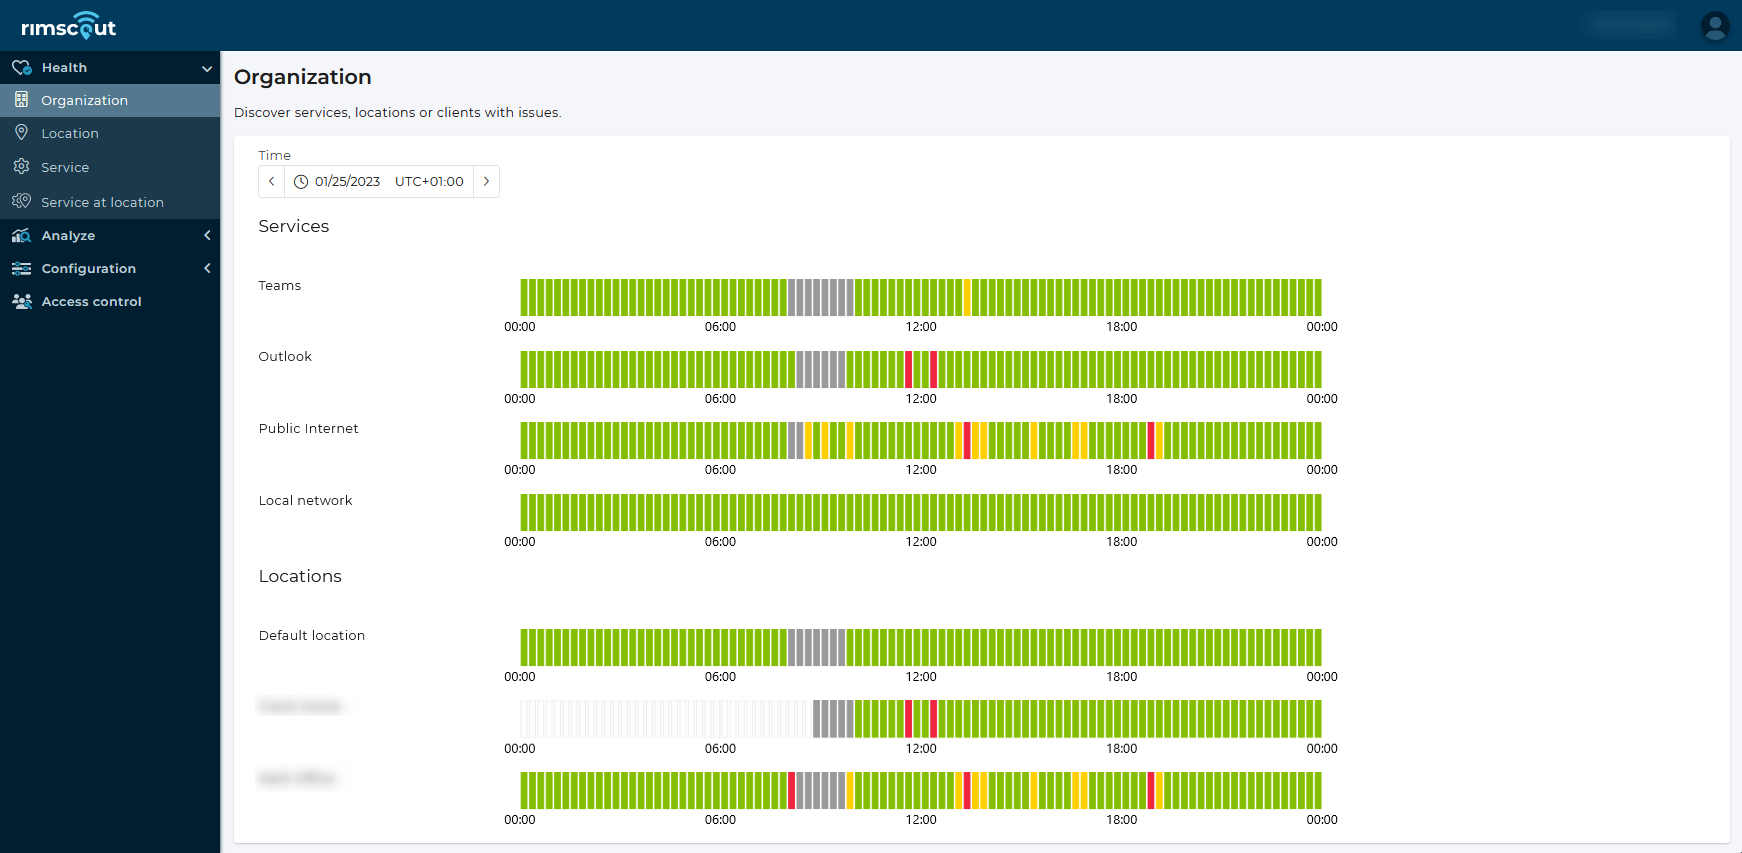
You can evaluate the results via this portal and even transfer them to your network management system. In this way, you can not only gain an overview of which location users may be experiencing problems, but also determine exactly whether these are in the local network, are due to the configuration of the end device, or are the responsibility of their cloud provider.
The Outlook outage can be easily seen by the gray bars on the screenshot. Each site cannot reach the service and this pattern can also be found in the individual clients.