

Author: Frank Carius
Enterprise Architect / Partner – connect on LinkedIn
Most companies nowadays more or less professionally operate local monitoring of services, network, and bandwidth. The overarching goal of administrators is to efficiently identify and resolve operational issues or performance degradation. Often, however, the performance and accessibility of each application at the individual user is a blind spot in traditional monitoring. Read this blog article to learn how Rimscout differs from traditional network monitoring tools and why the user is becoming increasingly important, especially in the cloud environment.
Classic network monitoring with Icinga, Nagios, PRTG and SNMP
In the context of classic network monitoring, solutions such as Nagios, Icinga, PRTG and WhatsUp Gold are widely used and thus present in many companies. All products use a central system to distribute configurations, collect results and visualize them. For this purpose, corresponding agents are distributed at each site or at defined external locations for local monitoring or checks of other systems. However, this configuration is static and not designed for flexible work at various locations with many clients, which is becoming more and more important in today’s world of remote work.
Network monitoring tools usually perform various checks and queries once a minute to capture the status of the network. For example, if you look at the queries of a local Exchange server, two categories can be checked:
In this example, the Exchange team can be alerted in case of problems and the network team can make general statements about the load of the network and especially the Internet output.
Do you focus on the clients of your users?
However, there are few network monitoring solutions that also include the individual client directly. How quickly, reliably, and stably the respective user can work with the service provided is only noticed by the specialist managers afterwards and indirectly via the number of support tickets. This is especially true for employees working from home who are connected via the Internet and, if necessary, via an additional VPN tunnel.
In many cases, there would be more clarity if the performance and accessibility at the user’s site were also actively determined and monitored. However, most network administrators do not regard themselves as responsible for this, and many Exchange administrators limit themselves to their servers and shy away from direct contact with the user. Thus, the actual performance at the user often remains a blind spot in many companies.
Cloud services change the requirements for network monitoring
With the use of cloud services such as Exchange Online, the focus of monitoring shifts significantly. Not only does the local Exchange server no longer serve as a monitoring point, but the connection paths also change with a “cloud” network design.

The various connection paths in a cloud network design differ from an on-premises network design.
- Office users bypass the on-premises Exchange server and connect to the cloud
- Branch offices with local breakout bypass the previously used WAN and leave the on-premises corporate network
- Users working from home connect directly to the service in the cloud
The logical consequence of this change: the network monitoring used up to now must be adapted accordingly so that you can continue to reliably detect where exactly a problem might exist. Of course, no one can monitor “the Internet” in its entirety, and hardly any providers allow you to look deep into their cards and allow SNMP access to the routers. Nevertheless, as an IT manager, you are not condemned to inactivity, because you can indeed actively monitor and measure, albeit differently than with your classic network monitoring, where bandwidth is often one of the most important metrics.
Latency instead of bandwidth – Why your monitoring needs a new metric
Compared to bandwidth, latency plays an increasingly key role when it comes to the performance and efficiency of digital systems. Bandwidth indicates the amount of data transported for a connection. Latency, however, refers to the time it takes to send a request and receive an appropriate response.
The values of bandwidth monitoring at their Internet access points are therefore only of limited significance because the path from the client to the service is significantly longer in a “cloud” network design. If there is a disruption on the transmission path and the packets cannot get back fast enough, the available bandwidth is not used at all. This disturbance on the transmission path can be reflected in a reduced bandwidth in your measured values and thus deceive you. The admin will rule out the network as the cause of the problem in this way, even though he can only safely provide data for part of the situation.
Instead of just looking at bandwidth, you should monitor the latency from suitable measuring points to the cloud service used. Most services can also be addressed anonymously, at least via PING or HTTPS, and the respective response allows you to make three reliable statements directly:
Only the monitoring of these three aspects will provide you with sound data for a successful analysis, because a mere consideration of the bandwidth used at your transition to the Internet is not sufficient for this purpose. Stay tuned, soon you can read more about latency monitoring on our blog.
Higher coverage for better measurement results
So classic network monitoring tools are optimal for monitoring services (up/down) and can also query their own network data at regular intervals via SNMP. In most cases a query is made every minute. The question is, how often do you need to measure latency?
The more frequently you take a probe, the more complete the monitoring will be, and you will be able to log even momentary problems on the connection. Audio and video connections are very susceptible to interference and thus require higher coverage with multiple measurements per minute to correctly detect dropouts. For example, Microsoft Teams sends about fifty packets/second during an audio conference and about 100 kbit/sec per participant, and Outlook is also reported at 4-8 kbit/sec. Even if you sacrifice only 0.1% of your bandwidth for latency monitoring, you can easily use test packets every second or even shorter for monitoring.
The close-meshed monitoring gives you a fully accurate indication of even short bad phases that your users would otherwise report as a problem and have gone unnoticed by you until now. Ideally, however, you check these connections not from a server in the server room, as with classic network monitoring, but directly from the client itself to the cloud.
Monitor the health of your services with the right tools and APIs
Assume that cloud providers also collect various telemetry data. Unfortunately, most providers do not provide any or only rudimentary data, and it does not cover all clients and time periods. For example, the OneDrive client and Outlook regularly check the connection using “TraceRoute” and reports the data to Microsoft. In both cases, however, you as a client of these services (still) remain blind. With Microsoft Teams alone, a Teams administrator can view a subset of the telemetry data in the portal. But is this sufficient?
However, again, you cannot and should not attempt to directly monitor the operation of a cloud service. Exchange Online, for example, runs a lot of servers for client access and certainly even more mailbox servers for databases, so it is unlikely that two users from the same company are working on the same server. Therefore, a synthetic functional test can only detect large damage cases at most. It is better here to use the APIs offered to transfer the health status of a service to your own monitoring. You can soon learn more about this topic in our blog article on proper monitoring of Exchange Online.
The new way of network monitoring with Rimscout
We now know that you need to adapt your classic network monitoring for cloud services and why collecting data from a server room is only of limited use. Only monitoring from the individual client to the cloud applications used by the user provides a complete and meaningful picture of your network environment. In this way, users’ performance or connection problems can be found quickly and narrowed down locally. This is an important aid, especially when working from home.
But even your self-operated services can be viewed as a “cloud service” that is only located in your own data center and has never been detected from a client until now. In addition, users working from home also use local services, such as VPN servers, terminal servers, or line-of-business applications, which you can monitor in the same way.
With Rimscout, you complement your classic network monitoring with a view of the individual clients, making performance or connection problems visible directly to your users. After you have started the Rimscout client on the desired end device, it automatically registers with your tenant’s portal. In the background, the client downloads the stored tests and immediately starts the selected measurements. The results arrive in your tenants, processed, so that you as an administrator can evaluate the respective status of your clients or also summarized of your locations via the Rimscout portal.
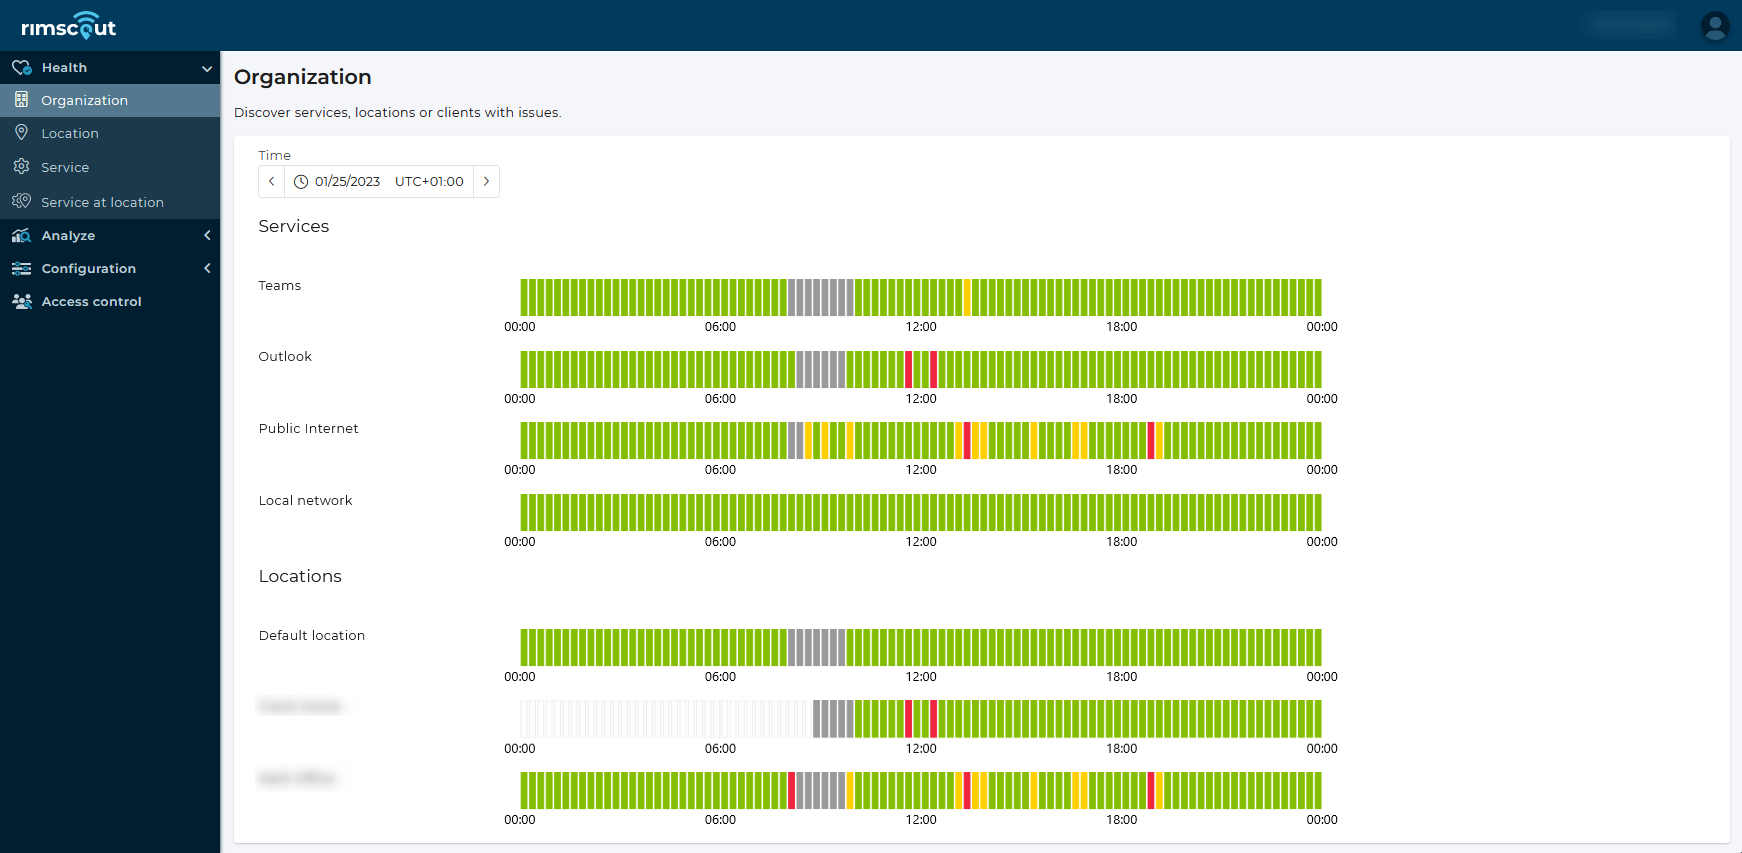
Overview of the current connection status of the selected services in the Rimscout portal
Selected alarms can be easily integrated into your existing network monitoring via a REST API to be informed about performance changes at an early stage. This way, in addition to monitoring your servers, switches and routers, you also benefit from monitoring your individual clients.