
Author: Frank Carius
Enterprise Architect / Partner – connect on LinkedIn
The Internet is unthinkable without routers and WAN connections. In addition, bandwidth has always been limited and required network monitoring. Due to the increased use of cloud services, video conferencing and streaming applications, bandwidths have continued to increase. However, monitoring has remained unchanged in many areas.
In this blog article you will learn why bandwidth-only measurement is no longer sufficient and how latency monitoring is key to effective network monitoring.
Origins of network monitoring
In August 1988, the first description of SNMP (Simple Network Management Protocol) was published with RFC 1067, which became the definition and basis of future monitoring solutions. At that time Tobias Oetiker developed the program MRTG (Multi Router Traffic Grapher) with Perl. With it, the number of incoming and outgoing packets and the amount of data transmitted in both directions could be read out and cleverly stored in a database each time a router was called up.
These generated graphs have a high recognition value until today:

Network bandwidth measurement limits
However, these figures and graphics must always be interpreted so that the correct conclusions can be drawn from them. The maximum usable bandwidth is not only determined by the transmission medium, but also depends on the capacity of the complete connection to the respective destination. For this reason, the informative value of local utilization is limited. Determining the bandwidth on an interface only shows what was transmitted on this partial link. However, the connection between two communication partners on the Internet consists of many partial links, which remain invisible in a bandwidth-only measurement.
Compare the problem with a car journey. You want to get to the airport on time and look through your room window at the road. You notice that there is neither a traffic jam nor any other congestion and that the garage exit is not blocked. This corresponds to your view of the interface of your firewall. In this way, you cannot tell if there is a disruption on the way to your destination. Even an accident at the next intersection with a traffic jam forming escapes your eyes.
However, long travel times by car or long package transit times in the network have an effect in a different way. You no longer wait until the acknowledgement of receipt arrives. A TCP/IP stack increases the “window size”, i.e., sends more packets on the journey to transmit the data. Conversely, if packets are lost, the senders throttle the sending rate because they assume the connection is congested. This is a completely expected process, because, naturally, a server with a gigabit card, for example, must adapt its sending to the capabilities of the slowest leg to the respective destination.
Measuring bandwidth only makes sense if you have the entire connection path under control. Until now, this was also the case when all servers and clients were on-premises and only the company’s own LAN/WAN was used. However, with increased cloud deployment, this picture is constantly changing.
Latency as the key for efficient network monitoring
With the cloud and the Internet, we recommend monitoring the duration of packets between the client and the server. For example, if the other side responds to an ICMP PING or an anonymous HTTP request, it is quite easy to measure the duration. Of course, these are additional packets which add some load, but the informative value makes up for this. A “free line” does not mean a fast line any more than a heavily loaded connection automatically means a slow line. Thus, a highway can be highly loaded if the traffic is moving, and everyone arrives at their destination within their time constraints.
However, the reverse is true: If the latency increases or is too high for the desired service, then the available bandwidth is overloaded, at least on a partial route. Routers always try to get rid of a packet as quickly as possible. However, congestion builds up a queue, which is reflected not only in latency but also in jitter and packet loss. These values influence the bandwidth measurement but are not explicitly reported.
There are matching functions in routers, e.g., Cisco IPSL, HP NQA, to continuously measure the partial routes as a provider. Unfortunately, this does not help customers such as you much since providers do not like to be shown their cards. However, only a few providers publish these results, as can be seen below in the example of Verizon.

In this example, average values of key routers are displayed. These values cannot be compared with your own connection. In addition, peaks disappear in the average. Therefore, you cannot avoid implementing your own measurements, e.g., with Rimscout.
More than just PING: Multiple ways to determine latency
The classic way to measure latency is to send an ICMP ping packet to the remote station, which responds as quickly as possible. In this way, a round-trip time (RTT) can be determined, which provides information about how quickly the packet took to get to the remote station and back. However, a PING is not always possible or meaningful. The remote station that answers an ICMP ping is a server at the end. In this way, the answer allows you to analyze how fast the network connection to the server is and if the server is reachable at all.
In cloud environments, HTTPS is the dominant protocol used to communicate with a service. If you want to check the accessibility, you can do this with an HTTP request to the service and measure the round-trip time. Many services require user authentication to use the service, but an anonymous request to the login page of the respective cloud service is also sufficient to obtain information about the network connection. The response when calling up such a login URL does not necessarily return a 200 OK, but a latency measurement is no problem with other status codes either. It should be noted that due to the size of the packets, TLS handshake, HTTP proxy servers and deep inspection, the response time of an HTTP request is higher than for an ICMP ping. In addition, packet losses are usually only indirectly noticeable via higher latency, since the underlying TCP stack first resends a packet before the transmission is aborted.
For video conferences, UDP is again the preferred protocol for transmitting voice data. Of course, it must be noted here that UDP is a connectionless protocol in contrast to TCP. Consequently, it is not always possible to measure a round-trip time since the remote station usually does not answer. However, especially with the TURN servers of Microsoft Teams, WebEx, Zoom or other providers, a response is returned, and the latency time can be measured.
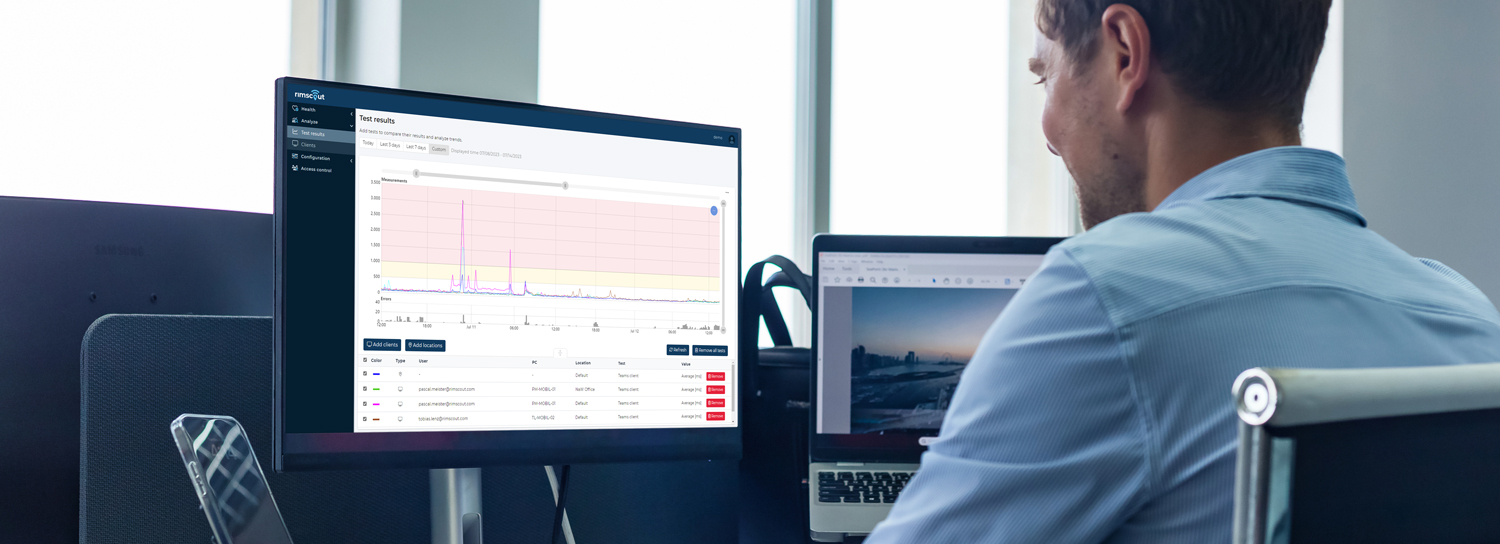
Continuous latency measurement for precise network monitoring with Rimscout
The increasing requirements due to cloud services or video conferencing pose challenges for your conventional network monitoring. Much more important than monitoring the bandwidth is monitoring the latency with the appropriate protocols per remote station. As described, it is not sufficient here to look at only a part instead of the entire connection path on the Internet, since congestion can be hidden on invisible sub paths. For this, the latencies should always be measured end-to-end, i.e., from the user’s point of view.
The challenge now is to reliably measure remote sites directly from multiple or all clients. Many cloud services already collect such information as part of telemetry but do not provide it to you as a client, or only to a limited extent. In addition, this data contains gaps if the software is not used or is not deployed on the client. It is therefore exceedingly difficult to compare different clients, locations, and network connections.
We recommend continuous measurement of the relevant defined connections and remote stations by as many clients as possible with Rimscout. With checks predefined by us and configured by you, you receive continuous latency measurements from all clients. Using suitable threshold values, you can easily identify all problematic clients, locations, or Internet providers. In this way, you can use targeted comparisons between the various measurements to isolate the cause increasingly precisely, and the path to a suitable solution becomes increasingly shorter.